Cyber Risk Quantification (CRQ): 7 Essential Steps to Master Financial Risk
What is Risk Modelling?
Cyber Risk Quantification (CRQ) is a way to quantify uncertainty, used across scenarios from being late to work to predicting financial crashes. It simplifies risk into:
Risk = Likelihood × Impact
Likelihood = how probable the event is
Impact = what happens if it occurs
Example – Lateness Risk:
Mumbai: Likelihood = 0.3, Impact = 60 → Risk Score = 18
Lucknow: Likelihood = 0.2, Impact = 30 → Risk Score = 6
The higher the score, the greater the risk. This principle applies broadly; from personal to systemic risks. In the digital realm, this is the foundation of Cyber Risk Quantification (CRQ).
Risk Modelling in Cybersecurity
In cybersecurity, risk modelling adapts these principles to quantify likelihood and impact of digital threats, replacing guesswork with data-driven security decisions.
Example Asset Register (3×3 risk assessment matrix):
| Asset | Threat | Value (Impact) | Likelihood | Risk Score |
|---|---|---|---|---|
| Employee Laptop | Malware Infection | Medium | High | Medium |
| Customer Database | Data Breach | High | Medium | High |
CRQ vs Risk Modelling
Risk Modelling = Designing the formula/logic (likelihood × impact).
Risk Quantification = Applying real data (probabilities, costs, financial estimates) to generate measurable values
.
Example – Phishing Risk
- Likelihood = 70% chance per year
- Impact = $500,000 per incident
- Expected Annual Loss (EAL) = 0.7 × $500,000 = $350,000
This allows leaders to evaluate ROI: e.g., invest $200K in email security vs. risking $2M in annual loss.
While Risk Modelling provides the mathematical framework, Cyber Risk Quantification (CRQ) requires granular data inputs to be credible. These inputs include Historical Loss Data (what similar events cost in the past), Frequency Data (external threat intelligence on likelihood), and Business Context (the financial value of the specific asset, e.g., $1M revenue per hour of uptime). This process transforms the simple ‘High/Medium/Low’ score into an Expected Annual Loss (EAL), enabling true financial comparison.
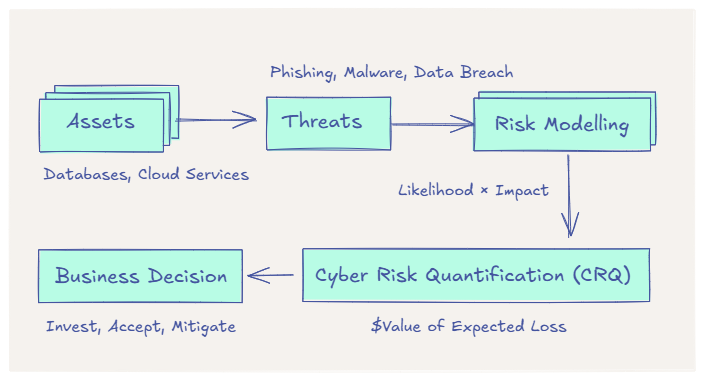
The implementation of Risk Modelling in CRQ follows these five core steps:
List key assets (laptops, servers, customer data, etc.)
Identify likely threats (phishing, ransomware, downtime, insider misuse)
Estimate likelihood and impact (High/Medium/Low or data-driven percentages).
Calculate and rank risks (Risk = Likelihood × Impact).
Decide on controls (compare cost of protection vs. loss).
Communicate in business terms (money, downtime, customer trust)
This allows leaders to evaluate ROI: e.g., invest $200K in email security vs. risking $2M in annual loss.
Different Risk Modelling Approaches to Cyber Risk Quantification (CRQ)
| Approach | Description | Pros | Cons | Best For |
|---|---|---|---|---|
| Qualitative | High/Medium/Low ratings | Simple, fast | Subjective, not precise | Early-stage orgs |
| Quantitative | Uses numbers & data | Financially measurable | Needs reliable data | Mature orgs with data |
| Scenario-based | “What-if” simulations | Great for planning | Limited by assumptions | Incident response planning |
| Statistical | Probabilities & simulations | Realistic, uncertainty-aware | Complex, data-heavy | Advanced risk teams |
| Standards-based | FAIR, NIST, ISO frameworks | Consistent, credible | Process-heavy | Compliance & benchmarking |
The FAIR (Factor Analysis of Information Risk) Model is the leading standard for quantitative CRQ. Unlike qualitative models, FAIR systematically measures the components of risk—Loss Event Frequency and Probable Loss Magnitude—in monetary terms. It uses ranges (e.g., probability between 10% and 40%) rather than single points, allowing risk analysts to communicate uncertainty to the business in terms of confidence levels, which is highly valuable for executives.
First-Party vs Third-Party Cyber Events
- First-Party Events: Directly impact your systems (e.g., Norsk Hydro ransomware, KNP transport ransomware).
- Third-Party Events: Originate in vendors/suppliers but disrupt your operations (e.g., SolarWinds breach, MOVEit exploit, Jaguar Land Rover shutdown).
The regulatory fallout from Third-Party Events is often more complex than that of a simple internal breach. Under laws like GDPR, HIPAA, and emerging SEC rules, companies are increasingly held responsible for their vendors’ security failures. A third-party breach triggers massive legal discovery costs, brand damage from being associated with a vendor failure, and potentially simultaneous regulatory fines in multiple jurisdictions, greatly multiplying the initial cost quantification.
Comparison Table:
| Factor | First-Party Event (Internal) | Third-Party Event (Vendor/Supply Chain) |
|---|---|---|
| Control | High – managed internally | Low – limited to vendor contracts/monitoring |
| Cost Drivers | Ransom, downtime, lost revenue | Legal liabilities, customer impact, supply chain issues |
| Time to Recover | Weeks to months (e.g., Norsk Hydro) | Months+ (e.g., MOVEit breach) |
| Regulatory Impact | Direct penalties for weak controls | Penalties via third-party oversight laws (GDPR, HIPAA) |
| Reputation Risk | Trust in your defenses lost | Weak vendor management perception |
| Scale of Impact | Contained to your org/customers | Broader cascade across industries and geographies |
Key Benefits of Cyber Risk Quantification
- Prioritizes risk decisions based on real financial impact.
- Evaluates exposure beyond assumptions.
- Supports ROI-driven security investments.
- Adapts with evolving threats and compliance needs.
- Aligns cyber risk with business language (cost, downtime, reputation).
Practical Implications:
- Identify top financial risks.
- Build prioritized risk register.
- Quantify business impact of outages or breaches.
- Justify security spending with measurable ROI.
- Enable risk-based decisions: accept, transfer, mitigate, or avoid risk.
How CTEM, EM, and CRQ Work Together
CTEM (Continuous Threat Exposure Management): Shows where you’re weak.
EM (Exposure Management): Maps overall attack surface.
CRQ (Cyber Risk Quantification): Tells what it could cost.
The synergy between these three concepts is crucial for a modern security program. CTEM and EM provide the likelihood inputs for CRQ by identifying and prioritizing the critical, exploitable weaknesses. For example, if Exposure Management shows that 50 of your 100 exposed servers run outdated software (High Likelihood), CRQ can then assign a specific dollar value to the cost of those 50 vulnerabilities being exploited. CRQ thus translates the ‘to-do list’ of Exposure Management into a prioritized spending plan.
Cyber Risk Quantification Vendors
| Vendor | Pros | Cons |
|---|---|---|
| SAFE Security | AI-driven, unified CRQ+CTEM, Forrester leader | Best for enterprises, integration-heavy |
| Kovrr | Supports FAIR/NIST, on-demand financial CRQ | Complex for small orgs |
| Bitsight | Efficient, benchmarking, insurance-related | Enterprise-level focus |
| Protiviti | Integrated CRQ + consulting support | Service-based, resourcing needed |
| Quantivate | Complete IT risk solution | IT risk-focused |
| RiskRecon | Third-party risk insights, free trial | Limited internal CRQ |
| Panorays | Business-specific vendor assessments | Limited CRQ, learning curve |
| DeNexus | OT/industrial CRQ, insurance benchmarking | Industrial-sector specific |
Conclusion
Risk Modelling structures how we frame likelihood and impact, while Cyber Risk Quantification translates risks into financial terms. Different models; qualitative, quantitative, scenario-based, statistical, or standards-driven; provide flexibility based on data and maturity.
By starting simple, staying consistent, and increasing sophistication over time, CRQ transforms cybersecurity from a technical burden into a strategic enabler for business decisions.


